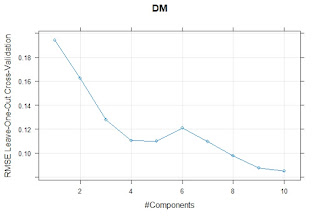
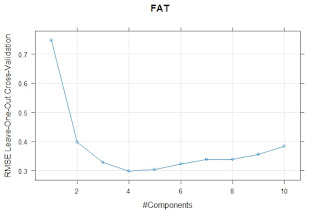
Now that we have extended the database, it is time to develop a new calibration with the 57 fish meal samples (merge of fish1 and fish2). I use this time Caret package to develop the new regressions for protein, moisture , fat and ash.
Let´s start by protein, where we still maintain the leave one out cross validation for the selection of the number of terms and for the stimation of the error we can get for new samples.
model_fish12_prot_pls <- train(PROTEIN~nir_1d,data=fish_1d_all,
method = "pls",scale=FALSE,
method = "pls",scale=FALSE,
na.action=na.omit,
trControl =trainControl("LOOCV"),
tuneLength = 10)
trControl =trainControl("LOOCV"),
tuneLength = 10)
Now we can check the plot for RMSECV to see the number of terms necessary for the better stimation for the Cross Validation Error.
ggplot(model_fish12_prot_pls)
As we can see we get the best tune with 10 terms, but the error with 4 terms is almost similar.
We
can try checking other type of cross validation using 10 groups (folds) for
example, but we get similar results. It seems that the necessary number
of terms will be of that order and we need to add more samples to make
the protein calibration more robust and stable.
model_fish12_prot_pls <- train(PROTEIN~nir_1d,
data=fish_1d_all,
method = "pls",scale=FALSE,
na.action=na.omit,
trControl =trainControl(
method = "cv",number=10),
tuneLength = 10)
We can see the statistics for every fold:
As we can see we have good correlations for every fold, and the RMSE (Root Mean Square Errors ) are aceptable taking in account that the parameter is protein and we have not too many samples yet.
To get the final statistics we can use:
getTrainPerf(model_fish12_prot_pls)
Where:
TrainRMSE..........Root Mean Square Error for the training samples
TrainRsquared.... R squared for the training samples
TrainMAE............Mean Absolute Error for the training samples
TrainRsquared.... R squared for the training samples
TrainMAE............Mean Absolute Error for the training samples
We can see in the following plots the terms for "Dry Matter", "Fat" and "Ash":
In the next post we will get spectra from a new season and we continue in a different way selecting samples for the lab.


No hay comentarios:
Publicar un comentario