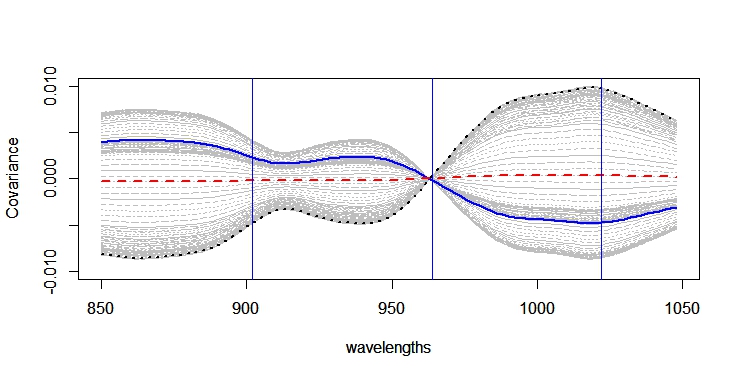
In the previous post we have seen the correlation plot and in this one the covariance plot matrix, we just have to change the function "cor" for "cov" in the code.
Covariance matrix is used frequently in chemometrics, like in this case to define the ellipse for the Mahalanobis distance using the covariance between the two axes (one for the 964 wavelength and the other the linear combination of wavelengths 1022 and 902 that we have seen in other recent post.
We can do this easily with the package chemometrics and this code:
x3_x1x2<-cbind(x3,x1x2)
library(chemometrics)
drawMahal(x3_x1x2,center=apply(x3_x1x2,2,mean),
covariance=cov(x3_x1x2),
quantile=0.975,col="blue")
to get this plot:


No hay comentarios:
Publicar un comentario