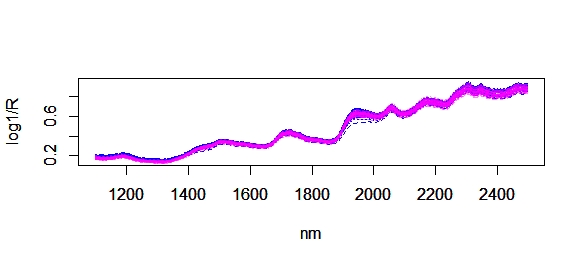
Once we have a starter calibration, we begin to analyze new samples and store their spectra. We keep the spectra and the sample correctly identified with the idea to send some of those new samples to the laboratory. This is the new situation where I have scanned 40 new samples, so I have 40 new predictions.
We can have at this moment three questions:
We can have at this moment three questions:
- Are the predictions aceptable according to the statistics we have seen during the regression development?.
- Are the new samples represented by the samples we have in the calibration?
- Do these new samples, or part of them, give new variability to improve the calibration database and their statistics?.
We try to give a response to this questions on the next posts. For the first question and part of the third one, we need to send some samples or all to the laboratory. But questions two and third will help us to define which samples we will send to the laboratory in order to expand the calibration to perform better for future samples.
Now we can use R to have a visual inspection overlapping the spectra of samples in the calibration (blue color) and spectra of the new 40 samples in pink color, and we do it with four ways:


No hay comentarios:
Publicar un comentario