The original dataframe is:
fish1_2d_df1<-data.frame(sample_id,month,
year,dm,protein,
fat,ash,I(nir_2d),
stringsAsFactors = FALSE)
When we proceed this way building the dataframe, "nir_2d" becomes an "as is" class, while the other objects of the dataframe are "numeric" or "characters". This is important when we want to plot the spectra with the function "matplot".
Now we sort it by the classical way, and we will give it another name (the default order is ascendant , the same for the tidyverse option):
fish1_2d_df1_fat<-fish1_2d_df1[order(fish1_2d_df1$fat),]
if we do it by tidyverse (text code for tidyverse in brown):
library(tidyverse)
fish1_2d_df2_fat<-fish1_2d_df2 %>%
arrange(fat)
Now the I want to substract the sample with the lowest content in fat (position 1) from the sample with the highest content of fat (position 40). I am going to do it with the classical way but the idea is all along this year try to learn and show you how we can do it with ggplot2 which is one of the tidyverse packages.
As the spectra with second derivative is "asis", we need to convert it to a matrix:
nir2d_fat<-as.matrix(fish1_2d_df_fat$nir_2d)
matplot(wavelength_2d,t(nir2d_fat[c(1,40),]),
type="l",col=c("red","blue"),
xlab="nm",ylab = "log1/R",
main="Samples with lowest/highest fat content")
This way we plot in same way the spectral range for fat:
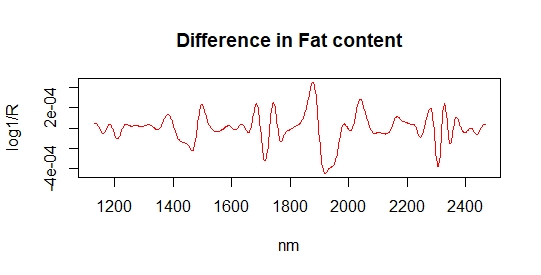
But let´s look better to the difference spectrum:
nir2d_fat_lowest<-nir2d_fat[1,]
nir2d_fat_highest<-nir2d_fat[40,]
diff_fat<-nir2d_fat_highest-nir2d_fat_lowest
matplot(wavelength_2d,diff_fat,type="l",col="red",
xlab="nm",ylab = "log1/R",
main="Difference high/low fat")
If we consult the bibliography the fat band for this type of product is a certain bands, so let´s draw some vertical lines at these wavelengths to see if it match with some bands of the difference range spectrum for fat:
abline(v=1200)
abline(v=1720)
abline(v=1760)
abline(v=2310)
abline(v=2340)
We can see that the fat bands appear in the difference spectrum.


No hay comentarios:
Publicar un comentario