The samples look like this:
But the best to see the differences, is to substract the spectra, so I made some substractions:
dif1<-selected[1,]-selected[6,]
dif2<-selected[2,]-selected[7,]
dif3<-selected[3,]-selected[8,]
dif4<-selected[4,]-selected[9,]
dif5<-selected[5,]-selected[10,]
and combined them:
dif<-rbind(dif1,dif2,dif3,dif4,dif5)
Now we can see the spectra of the differences (quite similar for the 5):
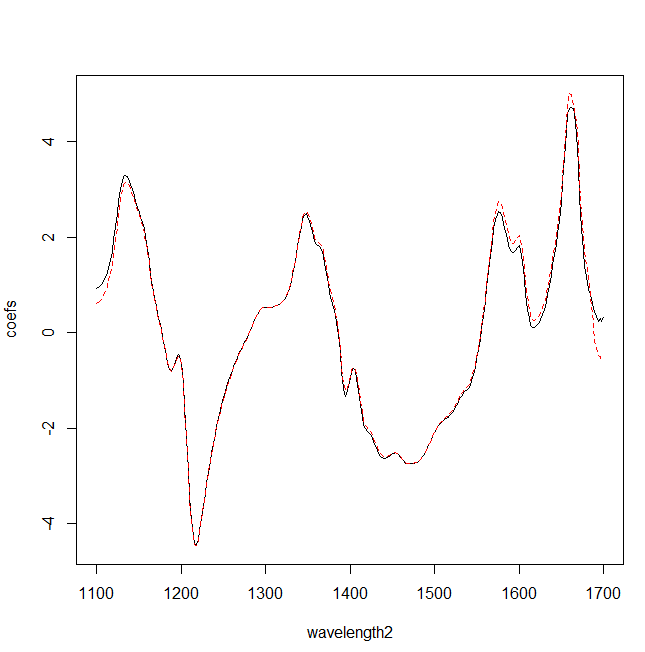
When developing the models (mod 1 and mod 2), we obtain the regression coefficient, which are like a spectra, so we can compare them:
and also substract them:
to obtain some conclussions.


No hay comentarios:
Publicar un comentario