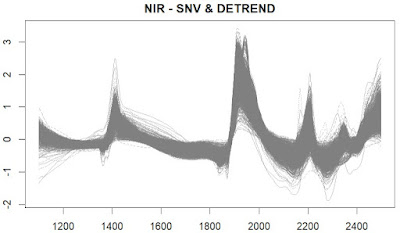
In this first plot we see the spectra of the LUCAS spanish database treated with the SNV and Detrend math treatment of the "Prospectr" package, where we remove the quadratic trend (as we saw in the last post):
The next step is to calculate the Principal Components Analysis, where we calculate the scores of every sample for the selected components. These scores are stored in a score matrix, which have a centre.
The next step is to measure the distance from every sample projected in the PC space to this centre. This distance (calculated with the function "fdiss" from the "resamble" package) can be represented in a plot aconsidering the spectra with distances higher than 3.00 as outliers.

Which are this samples? just mark them on the first plot and take out some conclusions:

As we can see they seem to be quite different of the average spectrum (considered the center), but we can consider that there are other samples which are not selected as outliers and they seem to be.
The normal procedure is to remove in a first step these samples, and calculate again the new centre with the rest and proceed with a new mahalanobis distance calculation
No hay comentarios:
Publicar un comentario