This is the third part of the series "Using Tecator data with Caret" , you can read first the posts:
When developing the regression for protein, Caret select the best option for the number of terms to use in the regression, so in this case that I have developed two regressions (PCR and PLS), Caret select 11 terms for the PLS regression and 14 for the PCR.
This is normal because in the case of PLS all the terms are selected taking in account how the scores (projections over the terms) correlate with the reference values for the parameter of interest, so they rotate to increase as much as possible the correlation value of the scores to the reference values. In the case of PCR the terms explain the variability in the spectra matrix and after a multiple linear regression is developed with these scores and is in this moment when the reference values are take it into account.
In this plot I show the XY plot of reference values of predictions vs. reference values for PCR and PLS over-plotted, with a validation set (sample removed randomly for testing the regression)
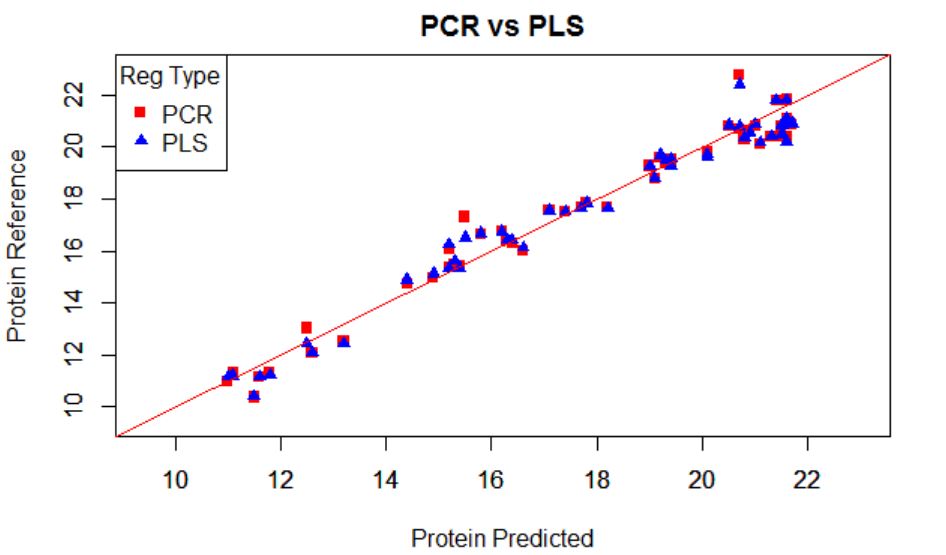
The error are similar for both:
RMSEP for PCR..................0,654
RMSEP for PLS...................0,605
No hay comentarios:
Publicar un comentario