When
developing a regression model is important to look to the XY regression plots
to check, not only for outliers, if not
for the shape of the dots (if they are linear or not). In this case the samples are from sausages
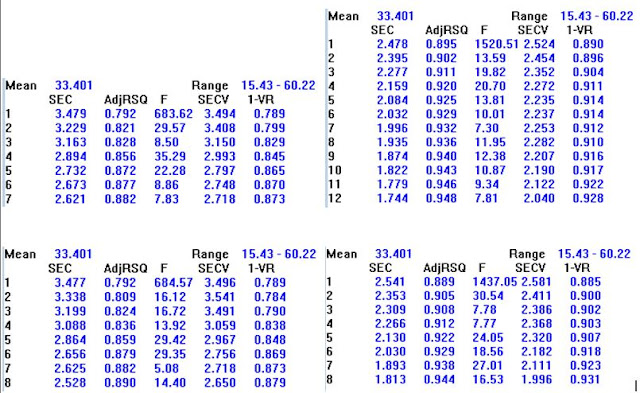
scanned in a NIT instrument (850-1050), and as you can see XY plots changes if
we use different anti-scatter plots. The derivatives are in all the cases the
same (first derivative with a segment of 4).
Statistics
will show us how many terms we have to use, the RSQ (for calibration and for
cross validation), and of course the SECV (standard error of cross validation) to
have an idea which model performs better.
As we can see in this case the best model could be the last one where we don´t use scatter correction (None), and the XY plots looks more linear. It has also the best SECV and 8 terms.
Of course model can be improve removing some outliers with large T value but in this case we don´t remove any outlier.
scatter correction.
This math tratment is the one I use for moisture, but it has not to be the same for the other parameters. We have to continue looking to the plots and statistics to check for the best option for each of them.


No hay comentarios:
Publicar un comentario