20 may 2016

Looking for the best Prediction Model


When developing a regression model is important to look to the XY regression plots to check, not only for outliers,  if not for the shape of the dots (if they are linear or not).  In this case the samples are from sausages scanned in a NIT instrument (850-1050), and as you can see XY plots changes if we use different anti-scatter plots. The derivatives are in all the cases the same (first derivative with a segment of 4).
Statistics will show us how many terms we have to use, the RSQ (for calibration and for cross validation), and of course the SECV (standard error of cross validation) to have an idea which model performs better.


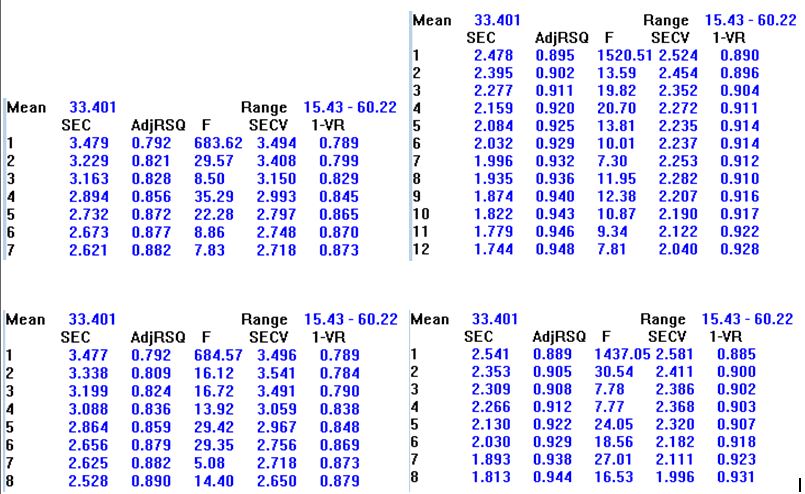
As we can see in this case the best model could be the last one where we don´t use scatter correction (None), and the XY plots looks more linear. It has also the best SECV and 8 terms.
Of course model can be improve removing some outliers with large T value but in this case we don´t remove any outlier.
scatter correction.
This math tratment is the one I use for moisture, but it has not to be the same for the other parameters. We have to continue looking to the plots and statistics to check for the best option for each of them. 

9 may 2016

USB to RS232 Converter for ISI Scan

I recommended in other post, the USB to Serial RS232 Belkin Converter, for ISI Scan users who change their computer and it has not a RS232 port to connect their instruments like NIR5000. We have tested that this adapter works fine and it can be get from Amazon.

En el caso de que hayas cambiado de ordenador y no disponga de puerto serie RS232 puedes usar este adaptador para trabajar con ISI Scan en equipos como el NIR5000. Hay otros adaptadores en el mercado, pero no conectan adecuadamente con el equipo usando el software ISI Scan. Lo puedes conseguir en Amazon.


5 may 2016

Validating LOCAL Models (Petfood)

Whenever possible I use LOCAL Models because they are quite easy to maintain. These are routine samples analyzed with the reference methods and plotted versus the predicted values. The statistics performs well and were into the error limits expected when the LOCAL Model was laoded for routine. There are small  slope shifts, but these validation samples will be included in the database to improve the model and make it more robust.
User also analyzed some special pet-food samples which have much more moisture (red crosses) and we can se how the moisture performs well, but with a high bias.

Statistics for Ash (Cenizas)
Samples used for Statistics    81
Slope                                 0.962
Intercept                            0.233
Bias                                  -0.075
SEP                                   0.649
SEP(C)                               0.649
RSQ                                   0.869


Statistics for Protein (Proteína)
Samples used for Statistics    98
Slope                                 1.011
Intercept                            0.153
Bias                                   0.439
SEP                                   0.714
SEP(C)                               0.566
RSQ                                   0.991


Statistics for Fat (Grasa)
Samples used for Statistics    83
Slope                                 0.915
Intercept                            1.094
Bias                                   0.084
SEP                                   0.649
RSQ                                   0.975


Statistics for Moisture (Humedad)
Without red ones
 Samples used for Statistics    116
Slope                                 1.021
Intercept                          -0.082
Bias                                   0.074
SEP                                   0.528
SEP(C)                               0.525
RSQ                                   0.786

If you are interested in LOCAL Models you can click on the LOCAL label, to see other posts like:

Studing structure in LOCAL for validation
LOCAL: Batch Mode to select Max Number of Samples
LOCAL: Creating the RED files