
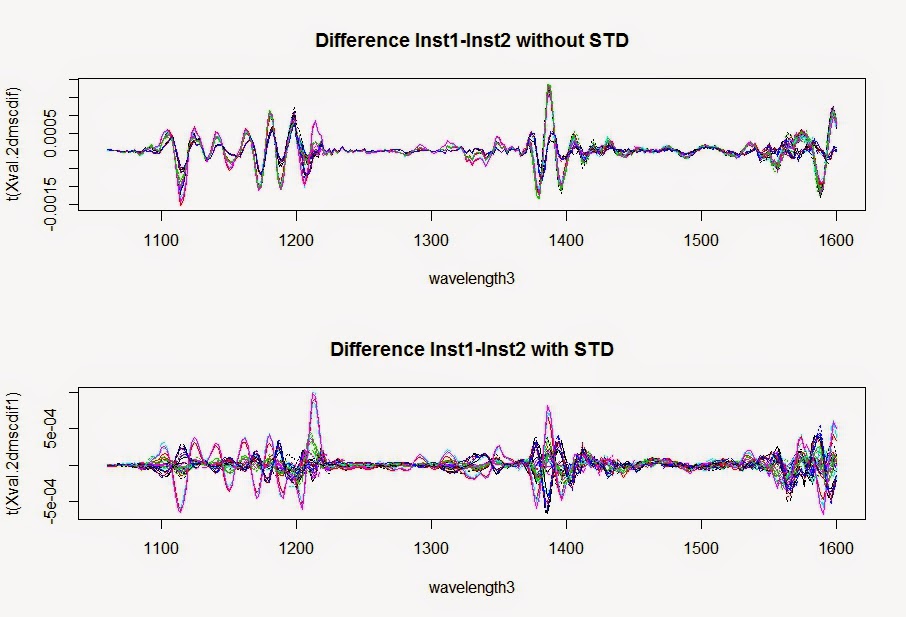
Spectra plots also will help us to understand how the STD correct the spectra, looking to the spectra and study the patterns we can see for wich samples works better or worse. We expect to see as much random noise as possible.
These plots are the validation samples of the Shootout 2002, with a standardization developed with a factor matrix multiplied to the unstandardized validation spectra. As said in previous posts, 8 samples were selected, but other samples could give (or not) similar plots.
Selection of samples is an important task. What is clear is that with the STD applied we get much better statistics as we saw in the post: "Standardizing the spectra (Shootout 2002)".
No hay comentarios:
Publicar un comentario