31 dic 2014

Searching / Archiving samples in ISI Scan

All the samples in ISI Scan are stored in the "data" folder in the ISI Scan directory. Keeping the Access data base, and  files included into that data folder is important to run the ISI Scan fast and secure.
So it is important to make backups regularly and clean the database at the same time. All this is configures at the System Profile window.

 
In this window, we configure the samples the samples which stay in the database and the samples which are exported or deleted definitively.
Spectra of samples with Lab Value attached are always kept in ISI Scan , so they can be exported as CAL files or used for Monitor purposes.
Read the ISI Scan Help section of System profile for a better understanding of the procedure.
After the Backup, a window appears searching for samples to archive:


Samples are archived in a new folder called Archive inside the Backup folder. Into this Archive folder there are new folders with the name of the products and inside this folders are the NIR files with the spectra, and the ANL or CSV files with the results. So you can export this files to Win ISI to work with them.

 
If the samples stay in the Data folder of ISI Scan and are not yet archived, we can search them clicking with the mouse on Products and selecting "Search". A new window appears where we have filter options, once searched the samples will go to the "Selected Samples" folder.


17 dic 2014

2 ways to draw a spectra set with plot 3D

Reading the article "Fifty ways to draw a volcano using package plot3D",
I wanted to test it with spectra (in this case treated with SNV). The result looks nice, but I have to practice more with it.
It seems that there are nice applications to use these plots in Chemometrics for tutorials, so more ideas are coming how to use them.

persp3D(z = X2.val_snv, facets = FALSE, col = "darkblue")
> persp3D(z = X2.val_snv) 

14 dic 2014

Plots to check the STD

 
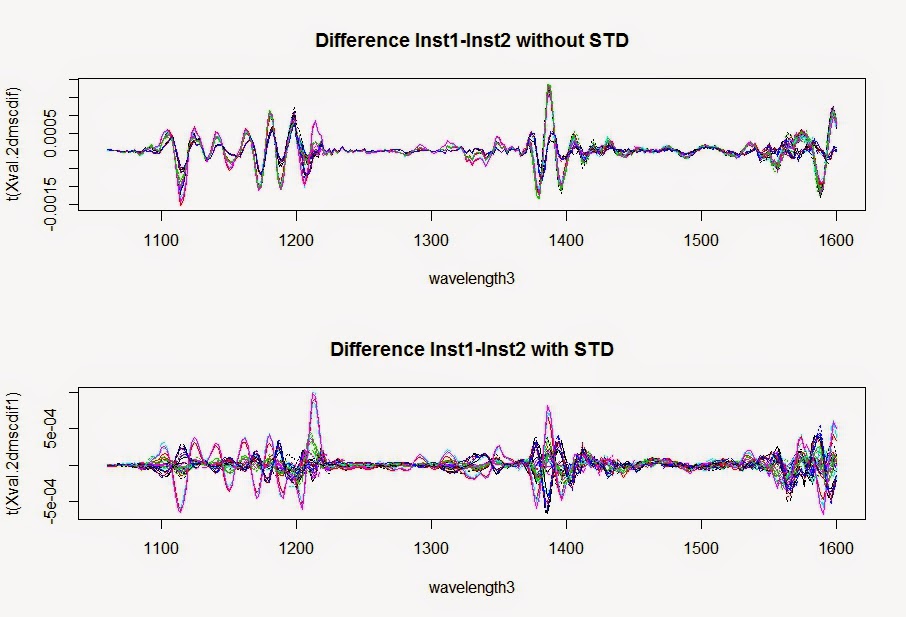
Spectra plots also will help us to understand how the STD correct the spectra, looking to the spectra and study the patterns we can see for wich samples works better or worse. We expect to see as much random noise as possible.
These plots are the validation samples of the Shootout 2002, with a standardization developed with a factor matrix multiplied to the unstandardized validation spectra. As said in previous posts, 8 samples were selected, but other samples could give (or not) similar plots.
Selection of samples is an important task. What is clear is that with the STD applied we get much better statistics as we saw in the post: "Standardizing the spectra (Shootout 2002)".


13 dic 2014

Plots to prepare the STD

In the previous post 8 samples were selected for the STD.
First figure shows the selected samples for the STD scanned (raw spectra) in Instrument 1 and 2, and the differences between them.
 
We can see the same procedure, but in this case the comparative is done with math-treatments (2º Derivative + MSC). As expected much more peaks in the spectra of the difference:
 
In a recent article from Mark Westerhaus to NIR News, he advice about the importance to check and review these plots and its shape, in order to apply the best standardization (single or multiple).
Comparing with more details the spectra, there are differences in the instruments not only in the photometric scale, also in the wavelength positions and in the bandwidth, but this differences are not constant all along the wavelength axis.
Actually manufacturers are improving the instruments to match each other, specially in the wavelength axis where more complex agorithms for correction are needed.

8 dic 2014

Standardizing the spectra (Shootout 2002)

We saw in the previous post that it was necessary to adjust the bias in Instrument 2, to get similar results to Instrument 1. Bias adjustment is the easiest way to transfer a model to other instrument if we see clearly the bias in the plots and if there is an improvement in the standard errors of predictions corrected by the bias (SEP).
But you know that this is not the better way to do the transfer. It is better to standardize the instruments being "Instrument 1" the "Master" and "Instrument 2" the "Host". For that reason I select a group of samples from the Test file scanned at Instrument 1 and the same samples scanned at Instrument 2, and calculate a correction Matrix to apply to all the spectra in  Instrument 2, to seem like they were scanned at Instrument 1. This procedure is described in the book "Chemometrics with R" - Ron Wehrens.
The results are a big improvement in the transferability.

These are the statistics monitoring the calibration samples of "Instrument 2" versus the model developed with the calibration samples of "Instrument 1", with and without "std".

# (without std..RMSEP: 3.642)       (with std..RMSEP: 2.913)
# (without std..Bias :-2.249)       (with std..Bias :-0.159)
# (without std..SEP  : 2.875)       (with std..SEP  : 2.918)


These are the statistics monitoring the Test samples of Instrument 2 versus the model developed with the calibration samples of "Instrument 1", with and without "std".

# (without std..RMSEP: 3.358)        (with std..RMSEP: 2.936)
# (without std..Bias :-1.712)        (with std..Bias : 0.390)
# (without std..SEP  : 2.892)        (with std..SEP  : 2.913)


These are the statistics monitoring the Validation samples of "Instrument 2" versus the model developed with the calibration samples of "Instrument 1", with and without "std".

# (without std..RMSEP: 5.635)        (with std..RMSEP: 2.961)
# (without std..Bias :-4.688)        (with std..Bias :-1.268)
# (without std..SEP  : 3.168)        (with std..SEP  : 2.71 )


4 dic 2014

Some script with the Shootout 2002 data

This is some script to check ho it performs a model developed with the training set C1  using the other sets T1 and V1, and C2,T2 and V2. All the sets from instrument 2 need a bias adjustment in order to transfer the model from Instrument 1 (mod3a) to instrument 2.

library(pls)
#Quitamos las 5 muestras que se observan como anómalas
#en el conjunto de calibración C1, que coinciden con las
#anomalas del conjunto de calibración C2.

nir.tr1a.2dmsc<-nir.tr1.2dmsc[c(-19,-122,-126,-127,-150),]
#Quitamos las muestras anomalas también de la matriz Y
#Hacemos la regressión con C1
mod3a<-plsr(Y~X,data=nir.tr1a.2dmsc,ncomp=10,validation="LOO")

#############  Validando con Test1 sin 7 anómalos
test1a.pred<-as.matrix(predict(mod3a,ncomp=3,newdata=nir.test1.2dmsc))
monit.test1a<-cbind(Y.test,test1a.pred)   #para poder usar la función monitor

#Tenemos que dar nombres a las columnas y poner el mismo número de decimales
colnames(monit.test1a)<-c("Y.test.lab","Y.test.pred")
monit.test1a<-round(monit.test1a,digits=1)
monitor14(monit.test1a[,2],monit.test1a[,1],150,3,0.95,2.904)

#Al predecir el conjunto de Test1, en el modelo mod3a, observaremos si tenemos anómalos.
#Se observa las muestras anómalas entre la linea de Warning i action:
# Las muestras son: 5,9,145,294,313,341 y 342.

nir.test1a.2dmsc<-nir.test1.2dmsc[c(-5,-9,-145,-294,-313,-341,-342),]
test1a.pred<-as.matrix(predict(mod3a,ncomp=3,newdata=nir.test1a.2dmsc))
monit.test1a<-cbind(nir.test1a.2dmsc$Y,test1a.pred)     #para poder usar la función monitor
colnames(monit.test1a)<-c("Y.test.lab","Y.test.pred")
monit.test1a<-round(monit.test1a,digits=1)
monitor14(monit.test1a[,2],monit.test1a[,1],150,3,0.95,2.904)

##  RMSEP: 3.05

#############  Validando con Val1  ################################
val1a.pred<-as.matrix(predict(mod3,ncomp=3,newdata=nir.val1.2dmsc))
monit.val1a<-cbind(Y.val,val1a.pred)   #para poder usar la función monitor
colnames(monit.val1a)<-c("Y.val.lab","Y.val.pred")
monit.val1a<-round(monit.val1a,digits=1)
monitor14(monit.val1a[,2],monit.val1a[,1],150,3,0.95,2.904)

##  RMSEP    : 3.676

#############  Validando con C2  ######################################
#Quitamos las muestras anómalas del conjunto de calibración C2
nir.tr2a.2dmsc<-nir.tr2.2dmsc[c(-19,-122,-126,-127,-150),]
tr2a.pred<-as.matrix(predict(mod3a,ncomp=3,newdata=nir.tr2a.2dmsc))

#para poder usar la función monitor
monit.tr2a<-cbind(nir.tr2a.2dmsc$Y,tr2a.pred) 
#Tenemos que dar nombres a las columnas y poner el mismo número de decimales
colnames(monit.tr2a)<-c("Y.tr.lab","Y.tr2.pred")
monit.tr2a<-round(monit.tr2a,digits=1)
monitor14(monit.tr2a[,2],monit.tr2a[,1],150,3,0.95,2.904)

#  RMSEP: 3.642
#  Bias : -2.249
#  SEP  : 2.875
#***Bias adjustment is recommended***


#############  Validando con Test2 sin 7 anomalos  ##############
test2a.pred<-as.matrix(predict(mod3a,ncomp=3,newdata=nir.test2.2dmsc))
monit.test2a<-cbind(Y.test,test2a.pred)   #para poder usar la función monitor

#Tenemos que dar nombres a las columnas y poner el mismo número de decimales
colnames(monit.test2a)<-c("Y.test.lab","Y.test.pred")
monit.test2a<-round(monit.test2a,digits=1)
monitor14(monit.test2a[,2],monit.test2a[,1],150,3,0.95,2.904)

#Al predecir el conjunto de Test2, en el modelo mod3a, observaremos si tenemos anómalos.
#Se observa las muestras anómalas entre la linea de Warning y action:
# Las muestras son: 5,9,145,294,313,341 y 342.

nir.test2a.2dmsc<-nir.test2.2dmsc[c(-5,-9,-145,-294,-313,-341,-342),]
test2a.pred<-as.matrix(predict(mod3a,ncomp=3,newdata=nir.test2a.2dmsc))
monit.test2a<-cbind(nir.test2a.2dmsc$Y,test2a.pred)     #para poder usar la función monitor
colnames(monit.test2a)<-c("Y.test.lab","Y.test.pred")
monit.test2a<-round(monit.test2a,digits=1)
monitor14(monit.test2a[,2],monit.test2a[,1],150,3,0.95,2.904)

# RMSEP: 3.358
# Bias : -1.712
# SEP  : 2.892

#***Bias adjustment is recommended***

#############  Validando con Val2  #################################
val2a.pred<-as.matrix(predict(mod3,ncomp=3,newdata=nir.val2.2dmsc))
monit.val2a<-cbind(Y.val,val2a.pred)   #para poder usar la función monitor
colnames(monit.val2a)<-c("Y.val.lab","Y.val.pred")
monit.val2a<-round(monit.val2a,digits=1)
monitor14(monit.val2a[,2],monit.val1a[,1],150,3,0.95,2.904)

# RMSEP    : 5.635
# Bias     : -4.688
# SEP      : 3.168

#***Bias adjustment is recommended***

1 dic 2014

Recalculating the PLSR without outliers

When we developed the regression, we did nor remove any outliers from the calibration set, but now we are going to remove the 5 samples which seem clearly outliers, so we can give to results to the summary of the Shootout 2002, one will be the Standard Errors  of Prediction with all the samples, and other without these 5 samples (19,122,126,127 and 150).

These five samples are the same in the Training Set scanned in Instrument 1 and the Training Set scanned in Instrument 2, so it is clear that the problem is that the lab value does not correlate as the others with the spectra.
First, we remove the samples from the Training Set 1:

nir.tr1a.2dmsc<-nir.tr1.2dmsc[c(-19,-122,-126,-127,-150),]

Now, the new regression model without outliers, and with the math treatments we consider apropiate as MSC + Second derivative:

mod3a<-plsr(Y~X,data=nir.tr1a.2dmsc,ncomp=10,validation="LOO")

Comparing the summaries of the models with and without outliers we see the logical improvement.
 
We decide to use 3 terms in the model to predict the other sets. First we predict the Training Set scanned in Instrument 2, but without the 5 outliers:

nir.tr2a.2dmsc<-nir.tr2.2dmsc[c(-19,-122,-126,-127,-150),]
tr2a.pred<-as.matrix(predict(mod3a,ncomp=3,newdata=nir.tr2a.2dmsc))
monit.tr2a<-cbind(nir.tr2a.2dmsc$Y,tr2a.pred) 
monit.tr2 colnames(monit.tr2a)<-c("Y.tr.lab","Y.tr2.pred")
monit.tr2a<-round(monit.tr2a,digits=1)

Now with this table we can run the Monitor function:

monitor14(monit.tr2a[,2],monit.tr2a[,1],150,3,0.95,2.904)

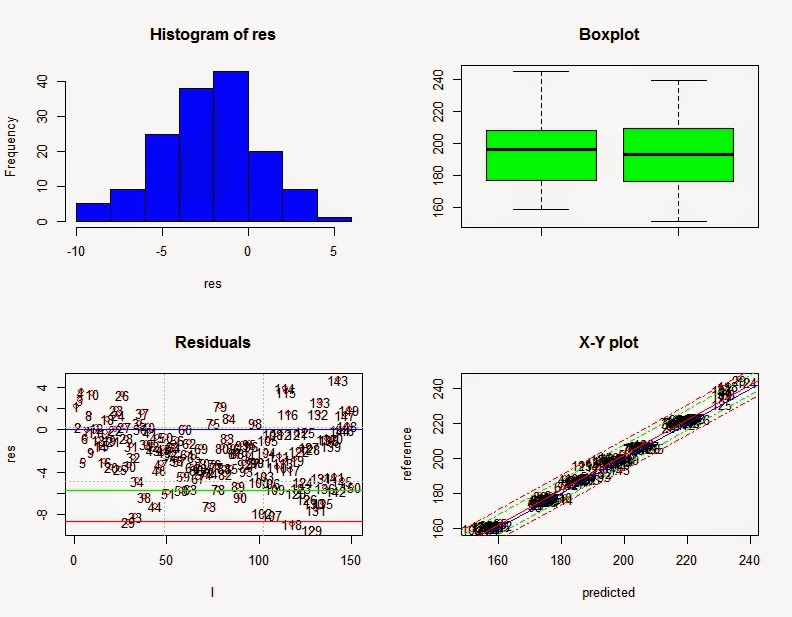
The results show an improvement in the RMSEP and the SEP statistic tell us the error corrected by the bias. The monitor function now recommend a Bias adjustment.
The distribution of the residuals shows the bias problem, but it is quite uniform once we correct the bias.
 
 
------------------------------------- 
N Validation Samples  = 150 
N Calibration Samples = 150 
N Calibration Terms   = 3 
------------------------------------- 
RMSEP    : 3.642 
Bias     : -2.249 
SEP      : 2.875 
UECLs    : 3.327 
***SEP is bellow BCLs (O.K)***
Corr     : 0.9917 
RSQ      : 0.9834 
Slope    : 1.002 
Intercept: 1.874 
RER      : 29.92   Good 
RPD      : 7.759   Very Good 
BCL(+/-): 0.4637 
***Bias adjustment is recommended***
Residual Std Dev is : 2.884 
***Slope adjustment in not necessary***