20 dic 2022

PCA - NIT Tutorial (part 12)

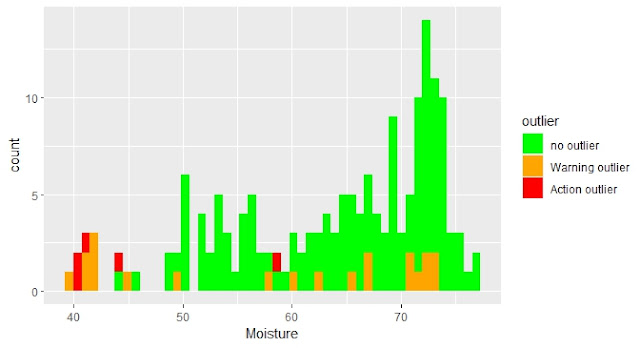
Hemos visto los anómalos de distancia de mahalanobis marcados en los histogramas para los distintos parámetros. Veamos estos mismos anómalos marcados en los gráficos de inter-correlación entre parámetros y en los espectros con su correspondiente tratamiento matemático.

Todas estas observaciones previas al desarrollo de los modelos de calibración nos pueden ser muy útiles.


In this post we see the intercorrelation plots between parameters and the spectra math treated with the warning and action outliers marked for study. Click the image to access to the quarto post.


16 dic 2022

PCA - NIT Tutorial (part 10)

click the image to access to the Quarto blog post.


En este post trato el tema del cálculo de la distancia de Mahalanobis en el espacio de componentes principales y cómo podemos visualizarla gráficamente con elipses en sus planos o también con cubos, marcando los anómalos con distancias superiores al umbral que determinemos.

In this post I talk about the Mahalanobis distance calculation in the Principal Component Space and how we can look at graphically with ellipses in the PCA scores maps planes or also in 3D with cubes.


PCA - NIT tutorial (part 11)


Does exist a relationship between the Robust Mahalanobis distances and the concentration of the parameters?.  Click the image to access to the Quarto blog post which explain it.