18 jul 2018
R for AI developers
R for AI developers: David Smith makes the case for R as a platform for developing models for intelligent applications, offering a few examples with details in the accompanying interactive code lab.
13 jul 2018
Validating Resemble Model with Monitor function
Continuing with this post evaluating the LOCAL model developed in Resemble. This time I use the Monitor function (one of the Monitor functions I am developing).
I create different subsets from the validation sample set for the different categories, In this case is for one time of puppies, and I am evaluating the moisture content. We can see that there are two outliers that increase the SEP, so we have to see if we remove this samples for some reasons.
Let´s validate first with this type of puppy subset and check the statistics:

Samples with the Sample IDs 463 y 456 are out of the action limits and the monitor function shows their position in the table:
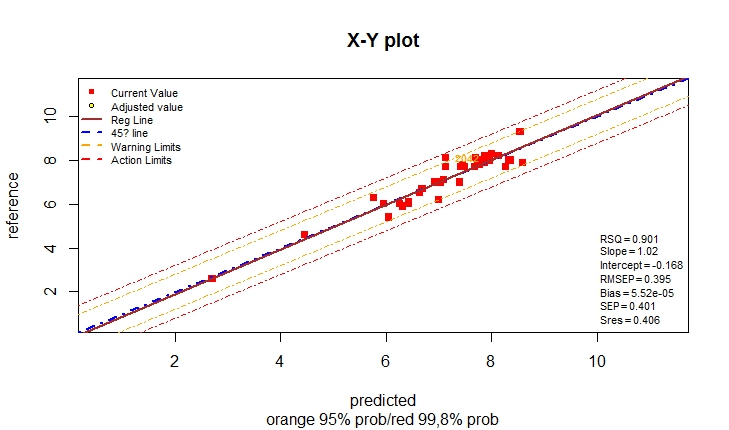
Now we can remove this samples knowing their position and recalculate:
val1.moi.pup1<-val1.moi.pup1[-c(32,34),]
monitor10c24xyplot(val1.moi.pup1)

I create different subsets from the validation sample set for the different categories, In this case is for one time of puppies, and I am evaluating the moisture content. We can see that there are two outliers that increase the SEP, so we have to see if we remove this samples for some reasons.
Let´s validate first with this type of puppy subset and check the statistics:
> val1.moi.pup1<-subset(val1.moi,ID1u_moi=="PUPPY-1")
> val1.moi.pup1<-cbind.data.frame(val1.moi.pup1$Sample.u_moi,
+                                 val1.moi.pup1$Yu_moi,
+                                 val1.moi.pup1$predicted.moi.local)
> monitor10c24xyplot(val1.moi.pup1)
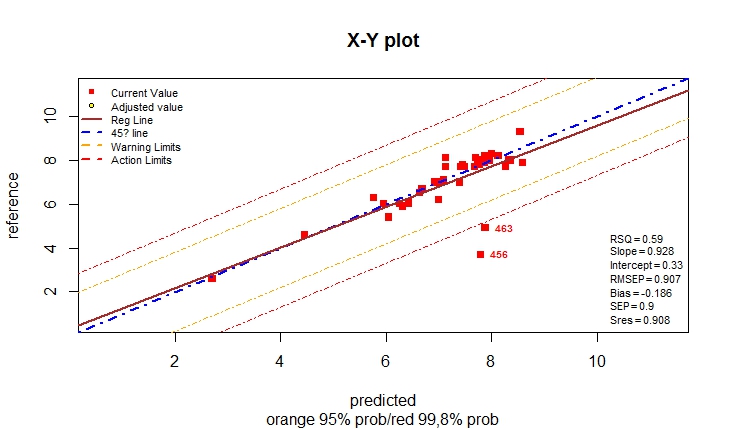
Samples with the Sample IDs 463 y 456 are out of the action limits and the monitor function shows their position in the table:
$ResWarning
[1] id ref pred res
<0 rows> (or 0-length row.names)
$ResAction
id ref pred res
34 456 3.7 7.793351 -4.093351
32 463 4.9 7.881543 -2.981543
Now we can remove this samples knowing their position and recalculate:
val1.moi.pup1<-val1.moi.pup1[-c(32,34),]
monitor10c24xyplot(val1.moi.pup1)
6 jul 2018
Plots in Resemble (part 2)
Good results for the prediction of the validation samples (Xu, Yu) for protein. This is the XY plot where we can see in different colors the classes of the validation samples (different types of petfood). the SEP is 0.88 (without removing outliers) . Defining the data frame by classes will allow us to see the SEP for every class so we can check which class needs for more samples in the training database (Xr, Yr) or to check for other reasons.
plot(predicted.local,Yu_prot,col=val1.prot$ID1u_prot,lwd=2)

El error SEP de las muestras de validación de proteína es : 0.887
El R cuadrado para las muestras de validación de proteína es: 0.962
Suscribirse a:
Comentarios (Atom)