hsoja.X<-as.matrix(read.table("clipboard",header=FALSE))
wavelength1<-seq(from=1100.0,to=2499.5, by=0.5)
X.ID<-seq(from=1,to=159, by=1)
colnames(hsoja.X)<-wavelength1
rownames(hsoja.X)<-X.ID
plot(as.numeric(colnames(hsoja.X)),hsoja.X[1,],
+type="l",xlab="wavelength",ylab="Absorbance")
matplot(wavelength1,t(hsoja.X),type="l")
hsoja.X.bin<-binning(hsoja.X,bin.size=4)
wavelength2<-seq(from=1100,to=2498, by=2)
colnames(hsoja.X.bin)<-wavelength2
matplot(wavelength2,t(hsoja.X.bin),type="l",
ylab="",xlab="Wavelength")
points(as.numeric(colnames(hsoja.X.bin)),
+hsoja.X.bin[1,],pch=2)
matplot(wavelength1,t(hsoja.X),type="l",ylab="",
+xlab="Wavelength",col="black")
par(new=T)
hsoja.Xsnv<-standardNormalVariate(X=hsoja.X)
matplot(wavelength1,t(hsoja.Xsnv),type="l",xaxt="n",
+yaxt="n",ylab="",xlab="",col="blue")
hsoja.Xsnvdt<-detrend(X=hsoja.X,wav=as.numeric(colnames(hsoja.X)))
par(new=T)
matplot(wavelength1,t(hsoja.Xsnvdt),type="l",
xaxt="n",yaxt="n",xlab="",ylab="",col="red")
h.soja.snvdt1d<-t(diff(t(hsoja.Xsnvdt),differences=1,lag=16))
wavelength3<-seq(from=1108,to=2499.5, by=0.5)
par(new=T)
matplot(wavelength3,t(h.soja.snvdt1d),type="l",
+xaxt="n",yaxt="n",xlab="",ylab="",col="green")
# All the sequence for the plot
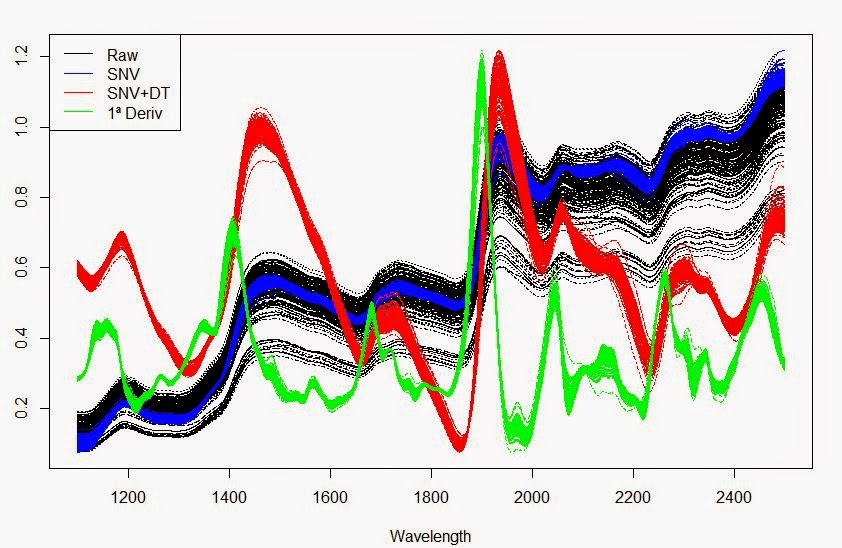
matplot(wavelength1,t(hsoja.X),type="l",
+ylab="",xlab="Wavelength",col="black")
par(new=T)
matplot(wavelength1,t(hsoja.Xsnv),type="l",
+xaxt="n",yaxt="n",ylab="",xlab="",col=4)
par(new=T)
matplot(wavelength1,t(hsoja.Xsnvdt),type="l",
+xaxt="n",yaxt="n",xlab="",ylab="",col=2)
par(new=T)
matplot(wavelength3,t(h.soja.snvdt1d),
+type="l",xaxt="n",yaxt="n",xlab="",ylab="",col="green")
legend("topleft",legend=c("Raw","SNV","SNV+DT","1ª Deriv"),
+lty=c(1,1),col=c("black","blue","red","green"))
No hay comentarios:
Publicar un comentario