This is the title of one of the presentations of the different methods used to determine the clay content in soils. You can download the presentation here.
30 jun 2024
Should laser diffraction become the new standard for soil particle size analysis ?
24 jun 2024
Improving the data downloaded from the ASD spectra in USGS
I continue downloading ASD spectra from thre USGS library, in order to have a data set of several clay minerals and as soon as you look to the spectra I get more ideas to improve the data set.
The header in the spectrum gives details such as the sample number, formula, type and spectral purity, so iI will use these data as variables that will improve the work.
I show you this spectra of the sample Kaolinite CM5 as an example:
22 jun 2024
USGS Reference Materials (Illite)
We can get spectra from the USGS library and with some work we can import them to R or any other chemometric software to work with them. In this case I search for "illite" ( a type of clay mineral) and I found these 12 samples to work in coming posts with them.
We can see the spectra samples overplotted:
14 jun 2024
How much kaolinite could contain my soil sample?
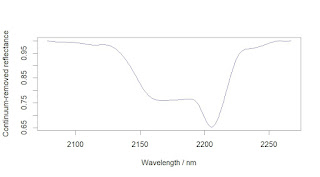
Now that we have our reference kaolinite near infrared spectrum stored and studied, we can acquire a we spectrum (unknown) and compare it with the reference material trying to have a clear idea od how much kaolinite could contain. Soils high or very high in kaolinite have disadvantages for agriculture, so looking to the comparison we can take some actions.
We are going to use one spectrum (the first one) from the soilspec package, where we have a data set called: "rutherglenNIR" which is a subset of soil spectra samples from the Rutherglen Area.
First, we compare the kaolinite reference material spetrum with the spectrum of the unknown sample:
10 jun 2024
Reference Materials (Kaolinite)
In the spectra of reference materials there are two kaolinite spectra, one is called kaolinite_114 and the other kaolinite_113. We can take them apart and overplot them in the same scale to see the differences:
6 jun 2024
3 jun 2024
How "spectra2colour" function from "soilspec" get the colour predicted values
In the soil spectrum the colour regions are defined, and the mean reflectance value obtained for each. With the three values (RGB) we obtain a colour prediction when proyected on the RGB cube space.
31 may 2024
Colour predictions with soilspec package
The soilspec package comes with a data set called specSoilCol, which has 12 spectra of four types (A, B, C and D) of soils at three deferent depthss (Horizons 1, 2 and 3).
The spectra is a Reflectance scale:
30 may 2024
Colour data available in soilspec package
Once we have installed the soilspec package we need some data (spectra) to work with, so we can import our own data, or to use the data available in the package (datsoilspc).
The data set has 391 spectra samples (range from 350 to 2500 nm in 1 nm steps) acquired with an AgriSpec instrument using a probe. All the information of this dataset is given in the description of this file in the poject.
Once we have the data in the workspace we can plot it as a first and quick look, so we realize that we must treat these spectra in order to have a better idea of the characteristics of the samples.
The spectra come with four constituent values: clay, sand, silt and Total Carbon.
27 may 2024
soilspec R package (installation)
I want to test during the coming days the soilspec package. It is a package not available yet from CRAN, but you can get it from the author author`s GitHub . I use in this case the tar.gz file, and after I install from the folder where I download it.
Take care during the installation, because you can receive some warnings and errors telling you that you don´t have some dependencies, as in my case the "MatrixStats" and "clhs" packages. Once I have installed these packages, I have the soilspec package ready to use and in the coming posts we will work with it.


