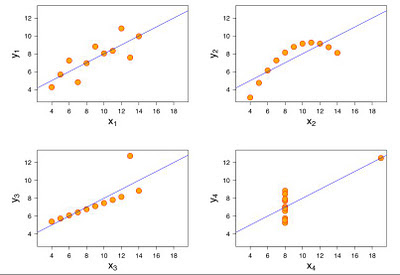
He visto en varias ocasiones (la última en: Data Mining and Predictive Analytics ) este ejemplo (Anscombe's quartet), que nos sirve para entender la importancia de la visualización de los gráficos. El los cuatro casos las tablas de datos presentan la misma media, desviación estándar tanto para X como para Y, también la correlación X-Y es la misma en los cuatro casos. De modo que unicamente los datos estadísticos no serán suficientes para juzgar estos datos.
Adjunto las imágenes de Wikipedia.
I read not long ago an article in the Tony Davies Column about this (allways look at the plots), and in the last post of one of the blogs I follow (Data Mining and Predictive Analytics ) this matter comes again using this famous example (Anscombe's quartet) to understand the power of the graphics.
In the four figures, we have the same average,standard deviation, correlation,.., for "Y" and "X", so if somebody gives you only the numbers, your idea of how the graphics are can be wrong. You need to ask for the graphics, or to have the original data table to plot them.
I attach also the Wikipedia images.

No hay comentarios:
Publicar un comentario