30 abr 2021

Working with Soilspec data (part 3)

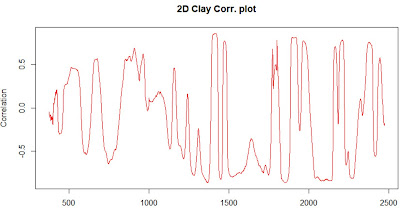
 One of the ways to see which can be the best math treatment for our spectra is to see the correlation plots versus a certain constituent, let´s say "clay" in this case. The "datsoilspc" data set has the reference values for the texture parameters and total carbon, so let´s use clay to calculate the correlation of the second derivative calculated in the previous plot with the clay parameter, and we do its wavelength by wavelength, so we get an spectrum.

The spectra of the second derivative is:


And now we calculate the correlation plot:

cor_spec2d_clay<-cor(datsoilspc$clay,spectra_2d[,1:2098])
matplot(as.numeric(colnames(spectra_2d)),t(cor_spec2d_clay),
type = "l",xlab="nm",col = "red", ylab="Correlation)"
main = "2D Clay Corr. plot")


Due that we are calculating the correlation with the second derivative spectra, we have to look to the negative correlations, and we can see that there are interesting zones (high correlated with clay) after 2000 nm, where clay minerals like "kaolinite" absorb NIR radiation.



Working with Soilspec data (part 2)

 In the previous post we have seen the Reflectance spectra of the "datsoilspc" data set available at the Soilspec R package,  and we have remove the scatter using the SNV algorithm. More treatments are available to remove the scatter like the algorithm "Detrend", that normally it is used in combination with SNV. 

Detrend removes the trending lines that can be linear or quadratic, and are applyed to every spectra individually, so they are applyed to the rows of X matrix.

I use in this case the package "prospectr" like in other posts to convert the raw spectra to a new spectra with the combination of SNV and Detrend, so let´s use the function "detrend":

library(prospectr)
spectra_snvdt<- detrend(spectra, as.numeric(colnames(spectra)))
matplot(as.numeric(colnames(spectra_snvdt)), t(spectra_snvdt),
        type = "l", col = "blue", xlab = "wavelength",
        ylab = "Reflectance")


As we know, the band in the NIR region are very overlapped so it is common to apply derivative to see more clearly the bands, and we can start with the first derivative. The derivative are calculated by differences, so resolution of the peaks change depending of the gap and segment we use. We have to find a compromise between a good resolution without to much noise. So try different configuration to find the best option.

spectra_1d<-gapDer(spectra_snvdt,m=1,w=21,s=4)
matplot(as.numeric(colnames(spectra_1d)),t(spectra_1d) ,type="l",
        col = "blue", xlab = "wavelength",
        ylab = "Reflectance")


Now we can apply the second derivative that can be consider the same calculation than the first derivative, but in thi case for the previous spectra:

spectra_2d<-gapDer(spectra_snv,m=2,w=21,s=4)
matplot(as.numeric(colnames(spectra_2d)), t(spectra_2d) ,
        type="l", col = "blue",
        xlab = "wavelength",
        ylab = "Reflectance")


This spectra is giving quite a lot information that we will try to discover in coming posts.

29 abr 2021

Working with the Soilspec data (part 1)

Once I have loaded the Soilspec package, it is time to start looking to the data.  The data is called "datsoilspc" which has 391 soil samples in the VIS-NIR range (from 350 to 2500 nm) with reference values for the texture parameters (Sand, Clay and Silt) and for the total carbon.

As we have done with other data, now we can load  in R, and after we can plot the raw spectra:

data('datsoilspc')
spectra<-datsoilspc$spc
matplot(wavelengths, t(spectra), type = "l",
        xlab = "wavelength", ylab = "Reflectance")


Due to the scatter we don´t se clearly the absortion band, so let´s apply a
Standard Normal Variate scatter correction:

spectra_snv<-scale(t(spectra),center=TRUE,scale=TRUE)
matplot(wavelengths, spectra_snv, type = "l",
        xlab = "wavelength", ylab = "Reflectance")

We can see the absortions around 1400, 1900 and 2200 nm, but there is more information in the visible range that we will try to understand.

We can see the histograms for sand, clay, silt and total carbon:

hist(datsoilspc$clay, main = "Clay")
hist(datsoilspc$sand, main = "Sand")

hist(datsoilspc$silt, main = "Silt")
hist(datsoilspc$TotalCarbon, main = "Total Carbon")

Let´s see what I can doo with all this data in coming posts.


28 abr 2021

Soilspec R package and book

I  attend last night the Webinar  organized by soilspectroscopy.org, because lately I am working with soil spectra data in the Near Infrared. More webinars are coming, so if you are interested visit this web page or follow it on tweeter (@soilspec).

There is a package and a book for this, and the author gave the address to download the package from github.

The is a book abour how to use this package as well, you can find on the Web.

Interesting, so I will have a look to it, and hope to share posts about in the future: